Use the graph to find a) the mode, b) the median, and c) the mean of the data, then, d) compare the measures of central tendency and describe any similarities or differences.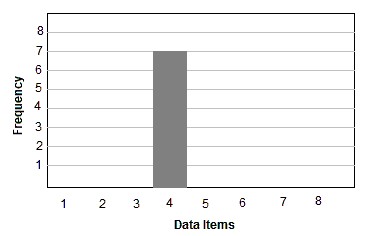
A. a) mode: 4
b) median: 4
c) mean: 4
d) The three measures of central tendency are the same.
B. a) mode: 7
b) median: 7
c) mean: 7
d) The three measures of central tendency are the same.
C. a) mode: 4
b) median: 7
c) mean: 7
d) The mode is less than the median or the mean.
D. a) mode: 7
b) median: 4
c) mean: 4
d) The mode is greater than the median or the mean.
Answer: A
You might also like to view...
Simplify the expression. ? 23 - 2·4 ?
A. 84 B. 4 C. –15 D. 15 E. 8
Solve the problem.Mr. Larsen's third grade class has 22 students, 12 girls and 10 boys. Two students must be selected at random to be in the fall play. What is the probability that no boys will be chosen? Order is not important.
A. 
B. 
C. 
D. 
Find the value of the objective function at each corner of the graphed region. Use this information to answer the question.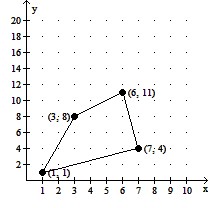 Objective Function z = 4x + yWhat is the maximum value of the objective function?
A. 50 B. 35 C. 13 D. 32
Convert the angle to decimal degree notation. Round your answer to two decimal places.64°21'
A. 64.35° B. 65.35° C. 64.21° D. 64.42°