The production possibilities curve shows that:
a. some of one good must be given up to get more of another good in an economy that is operating efficiently.
b. no output combination is impossible.
c. an economy that is operating efficiently can have more of one good without giving up some of another good.
d. scarcity can be eliminated.
a
You might also like to view...
Recall the Application. As the world price of wool decreased, the quantity of wool supplied by individual ranchers would ________, and the quantity supplied in the whole market would ________
A) decrease; increase B) increase; decrease C) increase; increase D) decrease; decrease
The figure above shows the market for milk. If the government pays the milk producers a subsidy and production increases to 300 gallons per day
A) the market is efficient because the marginal social benefit from the last gallon of milk exceeds its marginal social cost. B) the market is efficient because the total social benefit from milk exceed the total social cost. C) there is a deadweight loss because the marginal social benefit from the last gallon of milk exceeds its marginal social cost. D) there is a deadweight loss because the marginal social cost of the last gallon of milk exceeds its marginal social benefit.
If the economy in the graph shown is at point D, and the government wished to bring the economy back to its long-run equilibrium, it might:
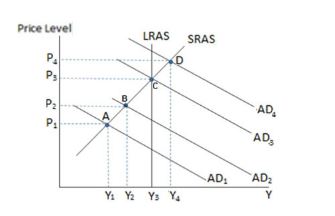
A. increase government spending.
B. decrease income taxes.
C. increase corporate income taxes.
D. All of these would bring the economy back to potential GDP.
Output per unit of input measures
A. Productivity. B. The investment rate. C. The inequality trap. D. Per capita GDP.