If the economy depicted in Figure 9.9 produced at a full-employment output level of $50 billion instead of the equilibrium output level, inventory levels would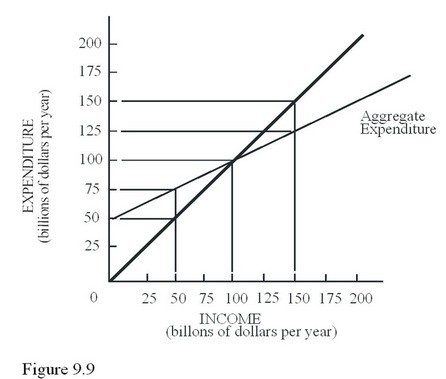
A. Decrease by $50 billion.
B. Increase by $25 billion.
C. Decrease by $25 billion.
D. Increase by $50 billion.
Answer: C
You might also like to view...
In the 1870s, excess capacity in the railroad industry led to:
a. rates wars. b. the formation of regional federations to pool traffic or profits. c. price-fixing. d. hidden rate-cutting through rebates. e. All of the above.
When regulating a natural monopoly, government officials
a. can set an efficient price, but the firm will suffer a loss b. can arrange a Pareto improvement by leaving the firm alone c. should force the firm to set a price equal to minimum marginal cost d. should force the firm to set a price equal to minimum long-run average total cost e. will increase efficiency if they force the firm to produce where MR = MC.
Is the actual amount of output that corresponds to the long-run aggregate supply curve fixed? Explain.
What will be an ideal response?
A consumer chooses an optimal consumption point where the
a. marginal rate of substitution is maximized. b. slope of the indifference curve exceeds the slope of the budget constraint by the greatest amount. c. ratio of the marginal utilities equals the ratio of the prices. d. All of the above are correct.