Refer to the information provided in Figure 2.6 below to answer the question(s) that follow.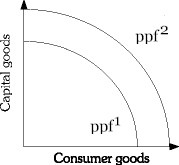 Figure 2.6Refer to Figure 2.6. If the economy is at ppf2, a change in consumer taste would be shown by a
A. movement along ppf2.
B. movement along ppf1.
C. shift from ppf2 to ppf1.
D. shift from ppf1 to ppf2.
Answer: A
You might also like to view...
The sum of payments made to resource owners for the use of their resources is
a. Gross Domestic Product b. Net Domestic Product c. National Income d. Personal Income e. Disposable Income
According to the quantity equation, if velocity and real GDP are constant, and the Federal Reserve increases the money supply by 5 percent, then the price level:
A. increases by 5 percent. B. decreases by 5 percent. C. decreases by more than 5 percent. D. increases by more than 5 percent.
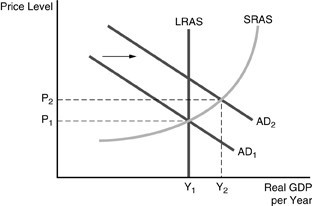 Refer to the above figure. Unexpected expansionary monetary policy has caused the aggregate demand curve to shift to AD2. In the short run
A. real GDP will be Y1, and the price level will be above P2. B. real GDP will be Y2, and the price level will be P2. C. real GDP will be between Y1 and Y2, and the price level will be between P1 and P2. D. real GDP will be Y1, and the price level will be P1.
Use the dynamic aggregate demand and aggregate supply model and start with Year 1 in a long-run macroeconomic equilibrium. For Year 2, graph aggregate demand, long-run aggregate supply, and short-run aggregate supply such that the condition of the
economy will induce the president and Congress to conduct contractionary fiscal policy. Briefly explain the condition of the economy and what the president and Congress are attempting to do. What will be an ideal response?