Refer to the figure at right. Moving from point A to point B indicates
Ans: A Decrease in Quantity Supplied
You might also like to view...
The above figure shows a perfectly competitive firm. If the market price is $5 per unit, the firm
A) will definitely shut down to minimize its losses. B) will stay open to produce and will make zero economic profit. C) will stay open to produce and will incur an economic loss. D) will stay open to produce and will make an economic profit. E) might shut down but more information is needed about the fixed cost.
"Perfectly competitive firms have total control over the price they set for their product." Explain why the previous statement is correct or incorrect
What will be an ideal response?
Refer to Figure 5-1. If, because of an externality, the economically efficient output is Q2 and not the current equilibrium output of Q1, what does S1 represent?
A) the market supply curve reflecting marginal social cost B) the market supply curve reflecting implicit cost C) the market supply curve reflecting external cost D) the market supply curve reflecting marginal private cost
According to the graph shown, if this were depicting an autarky economy, the equilibrium price would be:
This graph demonstrates the domestic demand and supply for a good, as well as the world price for that good.
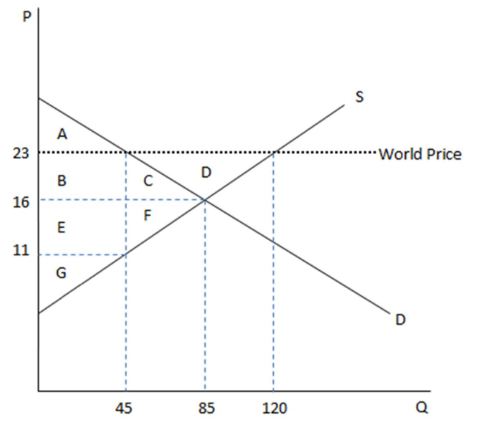
A. $23
B. $16
C. $11
D. $45