The following double-bar graph illustrates the revenue for a company for the four quarters of the year for two different years. Use the graph to answer the question. 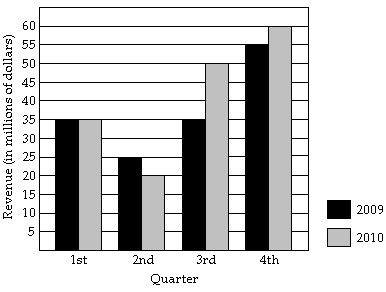 What was the difference in revenue between the third quarter of 2009 and the third quarter of 2010?
A. $5 million
B. $15 million
C. $1 million
D. $3 million
Answer: B
Mathematics
You might also like to view...
Provide an appropriate response.Solve: x4 - 7x3 - 30x2 = 0
Fill in the blank(s) with the appropriate word(s).
Mathematics
Write the equation of the line in slope-intercept form.Write the equation of the line perpendicular to 9x + 8y = 112 that passes through the point (-5, 17).
A. y = -  x +
x + 
B. y = -  x + 17
C. y =  x +
x + 
D. y = -  x + 112
Mathematics
Use the Factor Theorem to determine whether x - c is a factor of f(x).f(x) = 5x3 + 7x2 - 5x - 2; x + 2
A. Yes B. No
Mathematics
Solve the system by substitution. If the system is inconsistent or has dependent equations, say so.5x - 2y = -1 x + 4y = 35
A. {(2, 9)} B. {(3, 9)} C. {(2, 8)} D. {(3, 8)}
Mathematics