Use the figure below to answer the following question.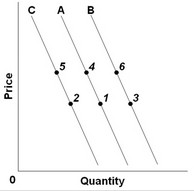 In the past few years, the quantity of donuts demanded has increased due to changes in the prices of donuts. This would be illustrated by a change from
A. point 5 to point 2.
B. point 1 to point 2.
C. point 3 to point 6.
D. point 4 to point 6.
Answer: A
You might also like to view...
Refer to Variable Cost of Production. For what levels of output does the firm experience diminishing marginal returns?
The following questions refer to the following table which shows a firm's variable costs of production.

a. For all levels of output.
b. For the first, second, and third units of output.
c. Beyond the third unit of output.
d. For the fifth and all subsequent units of output.
The figure above shows supply curves for soft drinks. Suppose the economy is at point a. An increase in the number of suppliers would be shown as a movement from point a to a point such as
A) none of the points that are illustrated. B) point b. C) point c. D) point d.
A photograph processing machine company requiring customers who buy a processing machine to purchase chemicals and photographic paper from it is an example of
A) bundling. B) a requirement tie-in sale. C) quantity discrimination. D) a two-part tariff.
Income is measured as
A. Neither a flow nor a stock. B. Both a flow and a stock. C. A stock only. D. A flow only.