The following table shows the number T, in millions, of international tourists visiting the United States t years after 2005.
t 0 1 2 3 T 49.88 51.65 55.40 57.04A: Find the equation of the regression line.B: Plot the data along with the regression line.C: Explain in practical terms the meaning of the slope of the regression line.D: What number of tourists does the regression line predict for 2011?
What will be an ideal response?
A: 
?
B:
?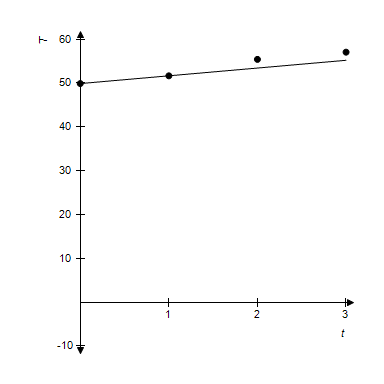
?
C: During the period from 2005 to 2008, the number of international tourists increased by approximately 2.53 million each year.
?
D: 64.88 million
Mathematics
You might also like to view...
The given point lies on the graph of the unit circle and corresponds to a real number t. Find the value of the indicated trigonometric function of t. Find cot t.
A. 
B. 
C. - 
D. - 
Mathematics
If is a differentiable function, find an expression for the derivative of 
What will be an ideal response?
Mathematics
Find the equation of the hyperbola satisfying the given conditions.Foci: (±2 , 0); asymptotes y = ± 3x
A.  -
-  = 1
= 1
B.  -
-  = 1
= 1
C.  -
-  = 1
= 1
D.  -
-  = 1
= 1
Mathematics
Prove that the identity is true.
?
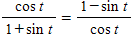
What will be an ideal response?
Mathematics