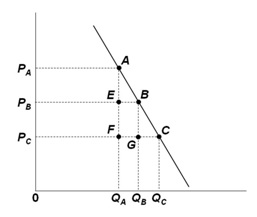
Refer to the below demand graph for a farm product. It suggests that farmers' revenues or incomes tend to:
A. Fall when the demand for the farm product increases
B. Fall when the supply of the farm product increases
C. Increase when the supply of the farm product increases
D. Be constant when supply of the farm product changes
B. Fall when the supply of the farm product increases
You might also like to view...
The strategy underlying price discrimination is
a. to charge higher prices to customers who have good substitutes available to them and lower prices to customers without many substitutes available to them.. b. to charge everyone the same price but limit the quantity they are allowed to buy. c. to increase total revenue by charging higher prices to those with the most inelastic demand for the product and lower prices to those with the most elastic demand. d. to reduce per-unit cost by charging higher prices to those with the most inelastic demand and lower prices to those with the most elastic demand.
When the economy devotes more of its resources to investment goods, it must devote fewer resources to consumer goods.
Answer the following statement true (T) or false (F)
Which is NOT true about the use of economic models?
A. Economic models are simplified representations of the real world. B. Economists use what has already happened in the real world to test their theories. C. Economists do not typically use experiments in science laboratories to test their theories. D. Economists are employed to explain economic phenomena but are never used to predict what might happen next.
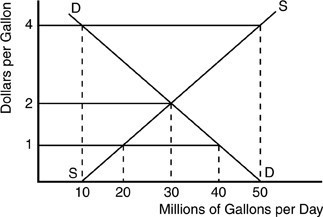 According to the above figure for a gasoline market, what happens when the price per gallon of gasoline jumps from $1 to $4?
A. The market moves from a shortage of 40 million gallons/day to a surplus of 50 million gallons/day. B. A surplus of 40 million gallons/day results. C. A gasoline surplus is replaced by a gas shortage. D. The market shortage is replaced by market equilibrium.