Write as a decimal. %
%
A. 5
B. 500
C. 0.0500
D. 0.0050
Answer: D
You might also like to view...
Graph the function f(x) over the given interval. Partition the interval into 4 subintervals of equal length. Then add to your sketch the rectangles associated with the Riemann sum  , using the indicated point in the kth subinterval for ck.f(x) = cos x + 3, [0, 2?], midpoint
A. 
B. 
C. 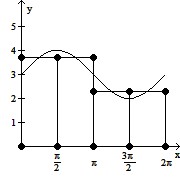
D. 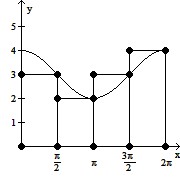
Solve the problem.In 1990 the number of factory pollution incidents reported in Country X was 7500. This number had decreased roughly at a rate of 440 per year since 1982. (i) Find an equation of a line  that describes this data, where y represents the number of pollution incidents during the year x. (Answers may vary.) (ii) Estimate the year when there were approximately 8250 incidents.
A. y = -440(x - 1988) + 7500; 1986 B. y = -440(x - 1982) + 7500; 1980 C. y = -440(x - 1990) + 7500; 1988 D. y = -7500(x - 1990) + 440; 1983
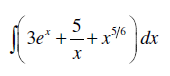
Evaluate the following:
1. ? dx
2. 
3. 
Write an equation in slope-intercept form for the line shown.
A. y =  x + 3
x + 3
B. y = 4x - 3
C. y = 4x + 3
D. y =  x - 3
x - 3