The table below shows the quantity of labor (measured in hours) and the productivity of labor (measured in real GDP per hour) in a hypothetical economy in three different years.
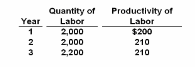
Refer to the above table. Between Year 2 and Year 3, real GDP increased by:
A. 2 percent
B. 5 percent
C. 10 percent
D. 15 percent
C. 10 percent
You might also like to view...
A nation has a population of 260 million people. Of these, 60 million are retired, in the military, institutionalized, or under 16 years old. There are 188 million who are employed and 12 million who are unemployed. What is the unemployment rate?
A. 27% B. 6% C. 9% D. 4%
Which of the following is a stock variable?
A) money supply B) wealth C) public debt D) all of the above
How does the text distinguish between coercion and persuasion?
A) Coercion uses force; persuasion uses reasoning. B) Coercion uses violence; persuasion is peaceful. C) Coercion cannot make everyone better off, but persuasion can. D) Coercion is evil, and persuasion is good. E) Coercion induces cooperation by threatening to reduce options, persuasion by promising to expand options.
If the trade line that passes through the production point on the PPC has a slope that is shallower than the slope of the PPC at the same point, then
A) the country can get greater gains from trade if it moves production away from the vertical axis. B) the country can get greater gains from trade if it moves production toward the vertical axis. C) the country cannot improve on its gains from trade. D) There are no gains from trade in this example. E) There is not enough information to tell how it can improve its gains from trade.