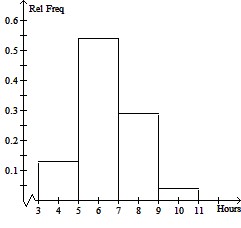
Construct a histogram for the given data. The following data are the number of hours spent preparing for a test by a sample of 24 high school students. The times (in hours) are as follows: 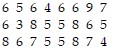 Use the given class intervals in the table below to construct a relative frequency histogram for the data.
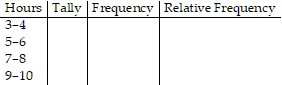
What will be an ideal response?
You might also like to view...
Solve the problem.Ken is 6 feet tall and is walking away from a streetlight. The streetlight has its light bulb 14 feet above the ground, and Ken is walking at the rate of 4.1 feet per second. Find a function, d(t), which gives the distance Ken is from the streetlight in terms of time. Find a function,  , which gives the length of Ken's shadow in terms of d. Then find
  . What is the meaning of
  ?
?
A. (S ? d)(t) gives the time in terms of Ken's distance from the streetlight. B. (S ? d)(t) gives the length of Ken's shadow in terms of his distance from the streetlight. C. (S ? d)(t) gives the length of Ken's shadow in terms of time. D. (S ? d)(t) gives the distance Ken is from the streetlight in terms of time.
Solve the triangle. Round lengths to the nearest tenth and angle measures to the nearest degree.a = 6, b = 9, C = 106°
A. c = 17.9, A = 26°, B = 48° B. c = 15, A = 30°, B = 44° C. c = 12.1, A = 28°, B = 46° D. no triangle
Provide an appropriate response.Fill in the blank with "always greater than," "sometimes greater than," "always less than," or "cannot be determined," whichever response is correct. When dividing a positive fraction by  , the answer is
  the fraction.
A. always greater than B. always less than C. sometimes greater than D. cannot be determined
Find the center and the radius of the circle.x2 + (y + 3)2 = 9
A. (0, 3), r = 3 B. (-3, 0), r = 9 C. (0, -3), r = 3 D. (3, 0), r = 9