A professor in your microeconomics lectures derived a labor demand curve in the lecture
Given some reasonable assumptions, she showed that the demand for labor depends negatively on the real wage. You want to put this hypothesis to the test ("show me") and collect data on employment and real wages for a certain industry. You try to estimate the labor demand curve but find no relationship between the two variables. Is economic theory wrong? Explain.
What will be an ideal response?
Answer: This is a case of simultaneous causality. Since there is a supply of labor as well, the real wage depends on employment, which, in a market-clearing model, is determined by the intersection of supply and demand. In a Keynesian world with wait unemployment, you would expect a negative relationship between real wages and employment, given the capital stock and productivity.
You might also like to view...
If stricter immigration laws are imposed and many foreign workers in the United States are forced to go back to their home countries,
A) we will move down along the long-run aggregate supply curve. B) we will move up along the long-run aggregate supply curve. C) the long-run aggregate supply curve will shift to the right. D) the long-run aggregate supply curve will shift to the left.
Suppose the equilibrium price of milk is $3 per gallon but the federal government sets the market price at $4 per gallon. The market mechanism will force the milk price back down to $3 per gallon unless the government:
A) rations the excess demand for milk among consumers. B) buys the excess supply of milk and removes it from the market. C) Both A and B are plausible actions. D) The government cannot maintain the price above the equilibrium level.
(Last Word) Suppose Balin has $100 to invest in an opportunity that returns, for every $100 invested, $120 if it goes well but only $80 if it goes poorly. If leverage allows Balin to borrow $90 for every $10 he invests, what are his rates of profit and
loss, respectively, if he borrows the full amount to invest in the opportunity? A. 20 percent profit; 20 percent loss. B. 33.3 percent profit; 50 percent loss. C. 200 percent profit; 100 percent loss. D. 1,100 percent profit; 100 percent loss.
Refer to the information provided in Figure 3.2 below to answer the question(s) that follow.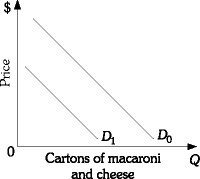 Figure 3.2Refer to Figure 3.2. Which of the following would be most likely to cause the demand for macaroni and cheese to shift from D1 to D0?
A. an increase in the price of flour used to make macaroni and cheese B. an increase in income, assuming macaroni and cheese is a normal good C. an increase in the price of macaroni and cheese D. an increase in the quantity demanded for macaroni and cheese