Table 9.1 Disposable IncomeTotal Consumption(Billions of dollars per year)(Billions of dollars per year)$0$50200210What is the marginal propensity to save in Table 9.1?
A. 0.05.
B. 0.20.
C. 0.80.
D. 0.24.
Answer: B
You might also like to view...
Use the following graph of the demand for noodles to answer the question below.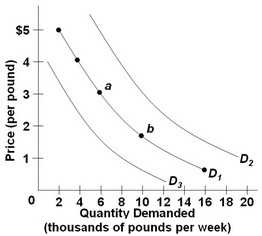 Refer to the three demand curves for noodles. Which of the following would shift the demand for noodles from D1 to D2?
A. an increase in the number of buyers of noodles B. People hear that eating noodles can have negative health effects. C. a decrease in the price of noodles D. a decrease in the number of buyers of noodles
When the yield curve is downward-sloping,
A) short-term yields are higher than long-term yields. B) long-term yields are higher than short-term yields. C) the bond market is anticipating the U.S. Treasury may default on its obligations. D) the inflation rate is expected to rise.
In Figure 22.1, which area represents consumer surplus to the drug addict? 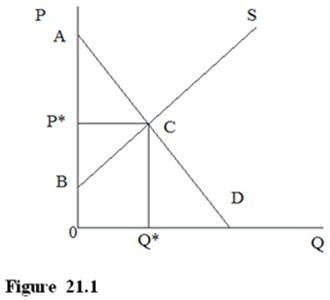
A. AP*C B. 0P*CQ* C. 0BCQ* D. 0ACQ*
If the marginal product of an input is falling, then
A) average fixed cost is constant. B) marginal cost is falling. C) average total cost is constant. D) marginal cost is rising.