In the graph shown, a downward shift in the SAS curve: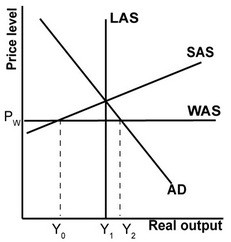
A. raises domestic consumption, because domestic producers produce more.
B. lowers globalized potential output, because domestic producers are more competitive.
C. raises the trade deficit, because domestic producers are more competitive.
D. raises domestic production, because input prices have fallen.
Answer: D
You might also like to view...
The above figure shows a monopolistically competitive firm. The figure
A) is only a short-run illustration because the firm is making an economic profit. B) could be either a short-run or long-run illustration because monopolistically competitive firms can make an economic profit in the long-run. C) is only a long-run illustration because the firm is making zero economic profit. D) is neither a short- nor a long-run illustration.
What is the primary reason for the differences between the U.S. banking system and those in other major industrial countries?
A) Economies of scale are greater in banking in the United States than in banking in other countries. B) legislation that led to the development of state and national banks C) the Federal Reserve System D) the National Bank
Use the concept of intertemporal substitution to explain how, in real business cycle models, a change in potential output causes an immediate change in actual output
What will be an ideal response?
If the cross price elasticity of two goods is -3.5, then
A) these two products are relatively elastic substitutes. B) these two products are relatively inelastic substitutes. C) these two products are relatively elastic complements. D) these two products are relatively inelastic complements.