After collecting the speed data in the table below on a highway with a speed limit of 55 mi/h, determine the percent of vehicles exceeding the limit. Also determine the percent of vehicles traveling within 5 mi/h above the speed limit.
What will be an ideal response?
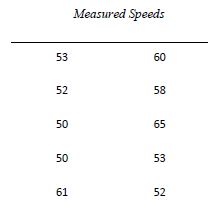
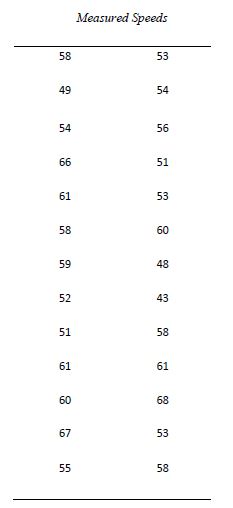
Compute the mean and standard deviation of the data provided:
Mean = 56.1 mi/h
Standard deviation = 5.7 mi/h
Since we are comparing the mean of the data to the speed limit, use Eq. 4.6 to
compute the Z-value
Z = (X – ave)/stdev
Z = (55 – 56.1) / 5.7
= -0.193
Look up this value in Table A.1 to obtain the area under the curve to the left of 55
mi/h = 0.425 or 42.5%. This is the percent of vehicles driving below the speed
limit. Subtract this from 100% to find the percent of vehicles driving above the
speed limit = 100% - 42.5% = 57.5%
Part 2 asks how many vehicles are driving “within 5 mi/h above the speed limit”
or between 55 and 60 mi/h. Given that 42.5% of vehicles are driving below 55
mi/h, use Eq. 4.6 again at 60 mi/h to find the percent of vehicles driving below 60
mi/h.
Z = (X – ave)/stdev
Z = (60 – 56.1) / 5.7
= +0.684
Looking this up in the standard normal distribution table gives 75.2% driving
below 60 mi/h. The percent of vehicles driving below 60 mi/h but above the 55
mi/h speed limit is 75.2% - 42.5% = 32.7%.
You might also like to view...
What is a standard output voltage of potential transformers?
a. 12V b. 24V c. 120V d. 240V
___________ involves splitting two embryos into two or more parts that produce genetically identical offspring
a. Meiosis c. Superovulation b. Embryo transfer d. Cloning
A ____ connection is the result of movement of the component leads or wire before the solder sets. It is evident by a granulated and frosty appearance with many cracks showing.
A. cold solder B. fractured or disturbed C. rosin D. wicking
A green home is painted green and is more comfortable for the occupants.
Answer the following statement true (T) or false (F)