Solve the inequality and graph the solution.p2 + 6p + 8 > 0
A. (-4, -2)![]()
| -4? | -2 |
B. (-2, ?)
| -2 |
C. (-?, -4) or (-2, ?)
| -4? | -2 |
D. (-?, -4)
| -4 |
Answer: C
You might also like to view...
Multiply.37(-5.83)
A. 42.93 B. -215.71 C. 31.17 D. 42.83
Solve the problem.The daily number of visitors v to an amusement park was always at least 833 but never more than 1292. Express this as an inequality.
A. v ? 833 or v ? 1292 B. 833 < v < 1292 C. 833 ? v ? 1292 D. v < 833 or v > 1292
Construct a pie graph, with sectors given in percent, to represent the data in the given table.
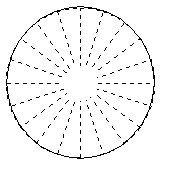
A. 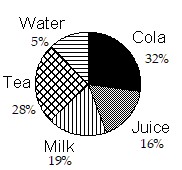
B. 
C. 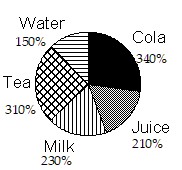
D. 
Find the expected value of the optimal strategy.A computer manufacturer must decide whether or not to market a new product. The new product may or may not be better than the old product. If they market the new product and it is better than the old product, their sales should increase. If they market the new product and it is not better, they will lose money to competitors. If they do not market the new product, they will lose to competitors if it is actually better and will lose just the research costs if it is not better. The manufacturer estimates that the payoff matrix is as follows: New Product BetterNot Better src="https://sciemce.com/media/4/ppg__tttt0625191052__f1q35g2.jpg" style="vertical-align: -15.0px;" />The manufacturer believes that the probability that the new product is better is 0.6. Find the expected profits if the manufacturer selects the best strategy.
A. $6000
B. $10,000
C. $3000
D. -$14,600