Use a finite approximation to estimate the area under the graph of the given function on the stated interval as instructed.f(x) = x2 between x = 0 and x = 3 using the midpoint sum with two rectangles of equal width.
A. 16.875
B. 8.4375
C. 12.5
D. 3.375
Answer: B
Mathematics
You might also like to view...
What kind of presentation is most appropriate for displaying the type of information below? The percentage of Biology majors each year since 1970.
A. table, bar graph, histogram, pie chart B. table C. bar graph D. bar graph, line graph E. table, bar graph, histogram
Mathematics
Graph the equation using the slope and y-intercept.2x - 3y = - 3
A. 
B. 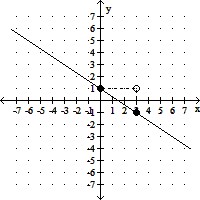
C. 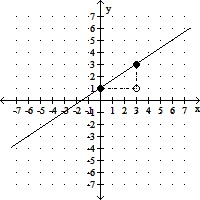
D. 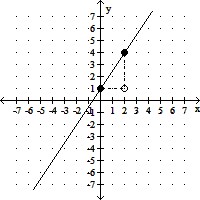
Mathematics
Plot the points on the rectangular coordinate plane.(5, 1), (-3, 4)
A. 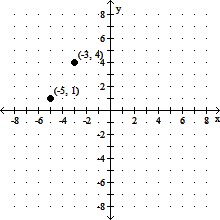
B. 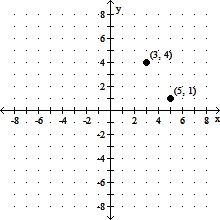
C. 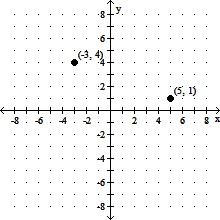
D. 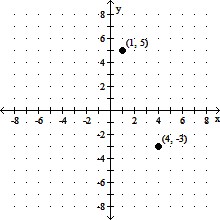
Mathematics
The graph of the function f(x) = x - 11x + 7 has been stretched horizontally by a factor of 2. Find the function for the transformed graph. Select the correct answer.
 multiple choice.png)
Mathematics