The bar graph shows the number of new residents in several towns during the years 1999 to 2001. Use the graph to answer the question. 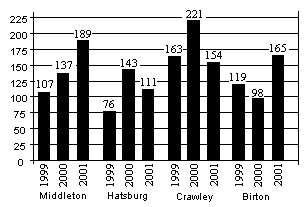 Of the total number of new residents in Hatsburg during the period 1999-2001, what fraction arrived in the year 2000?
A. 
B. 
C. 
D. 
Answer: C
You might also like to view...
Solve the problem.Identify the incorrect statements about limits.I. The number L is the limit of f(x) as x approaches x0 if f(x) gets closer to L as x approaches x0.II. The number L is the limit of f(x) as x approaches x0 if, for any ? > 0, there corresponds a ? > 0 such that  < ? whenever 0 <
  < ?.III. The number L is the limit of f(x) as x approaches x0 if, given any ? > 0, there exists a value of x for which
  < ?.
< ?.
A. II and III B. I and III C. I and II D. I, II, and III
Evaluate the expression.135/(-5)
A. - 
B. -37
C. -27
D. 27
Find the zeros of the polynomial function and state the multiplicity of each.f(x) = 4(x + 8)2(x - 8)3
A. x = -8, multiplicity 2; x = 8, multiplicity 3 B. x = 4, multiplicity 1; x = -8, multiplicity 3; x = 8, multiplicity 3 C. x = -8, multiplicity 3; x = 8, multiplicity 2 D. x = 4, multiplicity 1; x = 8, multiplicity 1; x = -8, multiplicity 1
Describe the given distribution with a circle graph.The following data give the color distribution of 700 carnations ordered by a local florist.PinkRedWhite210?350?140
What will be an ideal response?