First, create a scatter plot for the data in the table. Then, use the shape of the scatter plot given to determine if the data are best modeled by a linear function, an exponential function, a logarithmic function, or a quadratic function.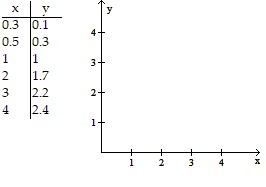
A. 
quadratic function
B. 
logarithmic function
C. 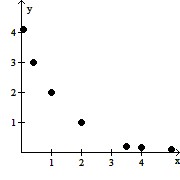
exponential function
D. 
linear function
Answer: B
You might also like to view...
Find the finance charge and total installment cost of the loan. Round to the nearest cent.Amount financed: $1,114.99Down payment: $95Cash price: $1,209.99Number of payments: 36Amount of payment: $39.20
A. $201.21; $1,506.20 B. $1,411.20; $1,601.20 C. $292.61; $1,601.20 D. $296.21; $1,506.20
Solve the equation by completing the square.x2 + 10x + 6 = 0
A. {-5 -  , -5 +
  }
}
B. {-10 +  }
}
C. {5 +  }
}
D. {5 -  , 5 +
, 5 +  }
}
Solve the problem.Economists use what is called a Leffer curve to predict the government revenue for tax rates from 0% to 100%. Economists agree that the end points of the curve generate 0 revenue, but disagree on the tax rate that produces the maximum revenue. Suppose an economist produces this rational function 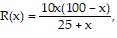 where R is revenue in millions at a tax rate of x percent. Use a graphing calculator to graph the function. What tax rate produces the maximum revenue? What is the maximum revenue?
A. 28.8%; $272 million B. 30.9%; $382 million C. 27.0%; $379 million D. 38.4%; $383 million
Find an equation for the ellipse described.Center at (0, 0); focus at (2, 0); vertex at (5, 0)
A.  +
+  = 1
= 1
B.  +
+  = 1
= 1
C.  +
+  = 1
= 1
D.  +
+  = 1
= 1