The following table shows the value V, in dollars, of a stamp collection after t years.
t 0 1 2 3 V $323.00 $345.61 $369.80 $395.69?
A: Make a table of successive ratios to show that the value of the stamp collection can be modeled by an exponential function. Round your answer to two decimal places.B: Find an exponential model for the data. Round your answer to two decimal places.C: Plot the graph of the data points along with the exponential model. Include up to 10 years.D: According to the model, what is the percentage increase in the value of the collection over a 4.00-year period? Round your answer to two decimal places.
What will be an ideal response?
?
| Time increment | From  to to  | From  to to  | From  to to  |
| Ratios of V |  |  |  |
?
B: 
C: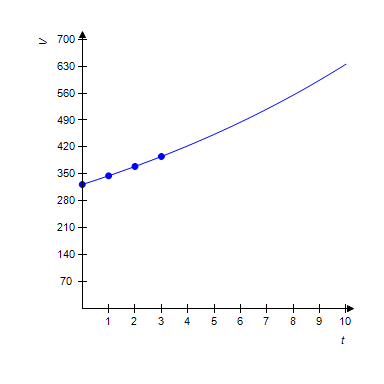
D: 31.08%
You might also like to view...
Write the expression in the standard form a + bi.(6 + 5i)(6 - 5i)
A. 36 - 25i B. 61 C. 36 - 25i2 D. 11
Solve.The gravitational attraction between two masses varies inversely as the square of the distance between them. If the force of attraction is 2.25 lb when the masses are 4 ft apart, what is the attraction when the masses are 6 ft apart?
A. 2 pounds B. 3 pounds C. 4 pounds D. 1 pound
The bar graph below shows the number of students by major in the College of Arts and Sciences. Answer the question.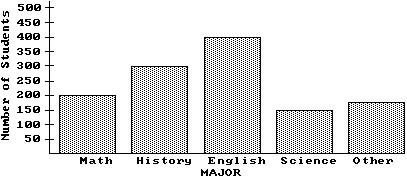 What is the ratio of English majors to math majors?
A. 2 to 1 B. 1 to 2 C. 3 to 2 D. 24 to 49
Write the interval as an inequality involving x. Graph the inequality.(5, ?)![]()
A. x < 5![]()
B. x ? 5![]()
C. x > 5![]()
D. x ? 5![]()