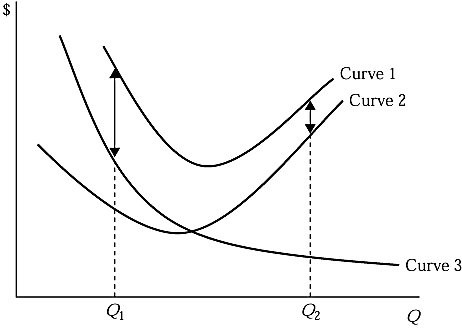
 Refer to Figure 5.2, which shows a family of average cost curves. The average variable cost at a given level of output is represented by:
A. the vertical distance between Curve 1 and Curve 3 at a given level of output.
B. the vertical distance between Curve 1 and Curve 2 at a given level of output.
C. the vertical sum of Curve 1 and Curve 3 at a given level of output.
D. the vertical sum of Curve 1 and Curve 2 at a given level of output.
Answer: A
You might also like to view...
Use the following graph of total revenues to answer the question below. 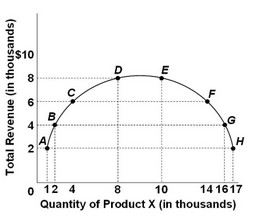 An increase in the quantity of product X demanded from 16,000 to 17,000 units implies that the price of product X was
A. reduced and the demand is inelastic. B. increased and the demand is inelastic. C. reduced and the demand is elastic. D. increased and the demand is elastic.
Assume the United States has an absolute advantage in the production of everything compared to the African nation of Berundi. Can you think of any reason why both nations would still find it to their mutual advantage to trade with each other?
What will be an ideal response?
When the price of a good rises, there is
A) an increase in supply. B) a decrease in supply. C) a decrease in quantity supplied. D) an increase in quantity supplied.
If the opportunity cost of producing wheat in Canada is four buffalo and the opportunity cost of producing wheat in the U.S. is seven sheep then we know that
a. four buffalo must trade for seven sheep b. seven buffalo must trade for three sheep c. we have insufficient information to determine anything about their trade d. the U.S. should specialize in wheat e. Canada should specialize in wheat