This graph depicts a tax being imposed, causing demand to shift from D1 to D2. According to the graph shown, the tax caused:
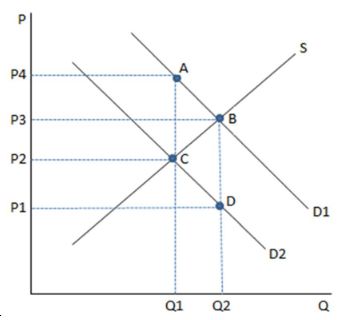
A. an increase in consumption from Q1 to Q2.
B. a decrease in consumption from Q2 to Q1.
C. a decrease in the price consumers pay from P3 to P1.
D. a decrease in the price the suppliers receive from P3 to P1.
B. a decrease in consumption from Q2 to Q1.
You might also like to view...
Some economists have suggested that network externalities result in consumers being locked into the use of products with inferior technologies
Economists Stan Leibowitz and Stephen Margolis have studied cases that have been cited as examples of this and found A) that consumers use products with inferior technologies when their prices are lower than products with superior technologies. B) that in all of these cases network externalities resulted in market failure. C) there is no convincing evidence that the alternative technologies were superior. D) consumers sometimes do become locked into the use of products with inferior technologies.
Subsistence production is
a. produced on the farm for a city market b. produced for export c. produced for sale to neighboring villages d. produced for consumption by the producer e. none of the above.
A consumer prefers market basket A to market basket B, and prefers market basket B to market basket C. Therefore, A is preferred to C. The assumption that leads to this conclusion is:
A) transitivity. B) completeness. C) all goods are good. D) diminishing MRS. E) assumption of rationality.
Low quality is essentially the same as
A) low price. B) efficient production. C) high price. D) low price elasticity.