Use the following table to answer the next question.YearUnemployment Rate (%)Inflation Rate (%)14.03.024.52.535.02.045.53.056.04.5Based on this data, the Phillips curve is ________.
A. of indeterminate slope
B. downward sloping
C. vertical
D. upward sloping
Answer: A
You might also like to view...
Which of the following is NOT one of the factors your text identifies that could affect the size of the multiplier?
A) What sector of the economy receives the initial increase in spending B) How the spending is financed C) Whether the economy is in recession or at full employment D) Whether the economy is in autarky equilibrium
The optimal level of air quality
a. is always zero b. occurs when the marginal social cost of air quality exceeds the marginal social benefit c. is greater if the marginal social benefit curve of air quality shifts rightward d. occurs when positive externalities are eliminated e. eliminates the common pool problem
Using the information in the table shown, what is the 2009 value of the salary listed in 1979?
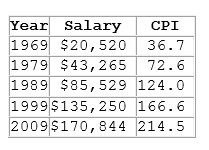
A. $127,828
B. $14,643
C. $57,824
D. $504,766
The average propensity to consume (C/Y) for the period 1970 to 1991 ranged between
a. 0 and - 0.80 b. 0 and 0.01 c. 0.65 and 0.80 d. 0.95 and 1.00 e. 1.20 and 1.50