Refer to the figure below.________ inflation will eventually move the economy pictured in the diagram from short-run equilibrium at point ________ to long-run equilibrium at point ________, 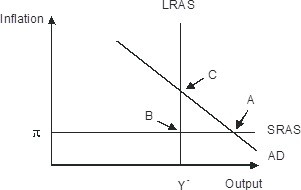
A. Rising; B; C
B. Falling; A; C
C. Falling; A; B
D. Rising; A; C
Answer: D
You might also like to view...
In a free trade area, member nations have no trade barriers among themselves, but are free to set their own trade policies toward nonmembers
a. True b. False Indicate whether the statement is true or false
Which of the following demonstrates the law of supply? a. When leather became more expensive, belt producers decreased their supply of belts
b. When car production technology improved, car producers increased their supply of cars. c. When sweater producers expected sweater prices to rise in the near future, they decreased their current supply of sweaters. d. When lemon prices rose, lemon growers increased their quantity supplied of lemons.
Which of the following does not increase (i.e., shift) the supply curve of real loanable funds?
a. Open market purchases of government securities by the central bank. b. A decrease in the discount rate. c. A decrease in the reserve ratio by the central bank. d. A decrease in the preferred asset ratio for near money (N/D), due to a shift in household preferences. e. All of the above increase the supply.
Based on the information in the table, what quantity of reserves did the Federal Reserve inject into the economy in 1932? Currency held by public(in billions)Reserve-deposit ratioBank reserves (in billions)Money supply (in billions)December 1931$4.590.095$3.11$37.3December 1932$4.820.109$3.18$34.0
A. $0.16 billion B. $0.30 billion C. $0.07 billion D. $0.23 billion