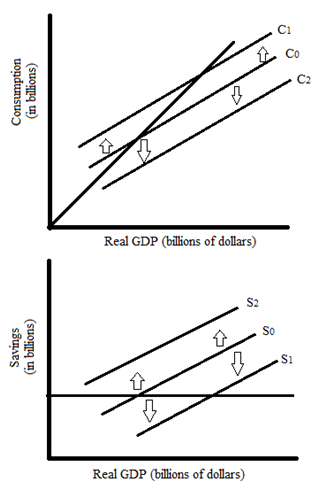
Discuss and show graphically how an increase in consumption at each level of GDP effects saving.
What will be an ideal response?
Typically if a household consumes more at each level of real GDP, they are saving less. A downward shift in the consumption curve corresponds with an upward shift in the savings curve. The reverse is also true, an upward shift in the consumption curve corresponds with a downward shift the supply curve.
You might also like to view...
Junkfood Jill spends all of her income on jellybeans and Jolt cola. Suppose that Jill's income is $30, the price of a bag of jellybeans is $6, and the price of a bottle of Jolt cola is $2
Which of the following combinations of jellybeans and Jolt cola lies inside of Jill's budget line? A) 5 bags of jellybeans and 0 bottles of Jolt B) 4 bags of jellybeans and 4 bottles of Jolt C) 3 bags of jellybeans and 6 bottles of Jolt D) 2 bags of jellybeans and 8 bottles of Jolt
The largest expenditure component in the U.S. is investment expenditures
Indicate whether the statement is true or false
Regarding the law of supply, which of the following statements is correct?
A) As the price of a good or service rises, the quantity supplied will increase. B) As the price of a good or service rises, the quantity supplied will decrease. C) The ceteris paribus assumption does not apply. D) As demand falls, supply rises.
Which of the following indicates the major difference between monopolists and competitive price searchers?
a. Monopolists will always be able to make economic profit; competitive price searchers will not. b. Barriers to entry are high under monopoly but low in competitive price-searcher markets. c. Monopolists will face a downward-sloping demand curve; competitive price searchers will not. d. Unregulated monopolists will charge prices that exceed marginal cost; competitive price searchers will not.