Answer the question based on the given graph.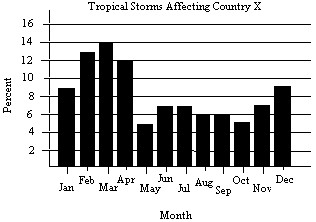 The data used to determine the graph were based on the number of tropical storms affecting Country X during the last ten years. A total of 572 tropical storms were reported. In which months were greater than 69 reported?
A. February, March, April
B. February, March
C. March
D. January, February, March, April, December
Answer: B
Mathematics
You might also like to view...
Solve the system of equations.
A. (2,  ), (-3,
  ), (2, -
 ), (-3, -
 )
)
B. (1,  ), (-3,
  ), (1, -
 ), (-3, -
 )
)
C. (1,  ), (-2,
  ), (1, -
 ), (-2, -
 )
)
D. No solution
Mathematics
Decide which property of addition is illustrated.2 + 8 = 8 + 2
A. Commutative B. Associative
Mathematics
Solve using the elimination method. If the system has an infinite number of solutions, use set-builder notation to write the solution set. If the system has no solution, state this. 8x - 4y = 24-5x - 2y = 12
A. (0, -6) B. No solution C. (0, -5) D. (-1, -5)
Mathematics
Evaluate the function.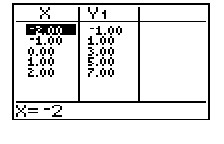 For the function y = f(x) described by the table, find f(2).
A. 2 B. 0 C. 7 D. Not shown
Mathematics