Solve the problem.The median household income of single mothers is shown in the bar graph, where the year 1995 corresponds to x = 5 and the year 2000 corresponds to x = 10. Use the information from the graph to write an equation to approximate the median income for 2005. Round to the nearest dollar.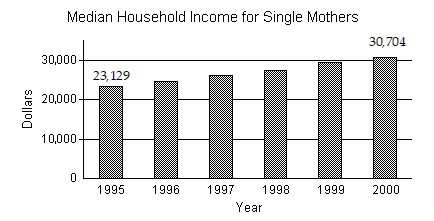
A. $30,704
B. $36,764
C. $39,794
D. $38,279
Answer: D
Mathematics
You might also like to view...
Find the vertex of the parabola.f(x) = -4x2 - 8x - 8
A. (-1, -4) B. (4, 1) C. (1, 4) D. (-4, -1)
Mathematics
Each number below is the number of miles the Hoover family has driven in a week. Determine the frequency of the class interval for this data. 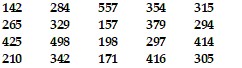 Miles Driven
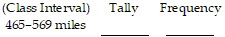
A. 4 B. 3 C. 1 D. 2
Mathematics
Plot the two points given by the ordered pairs.A(3, 5), B(-2, 1)
A. 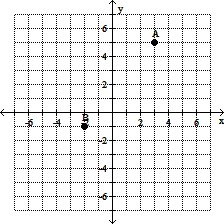
B. 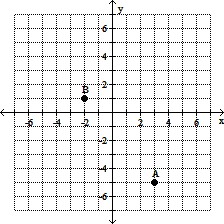
C. 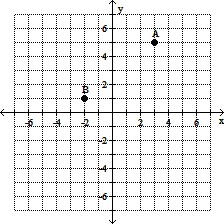
D. 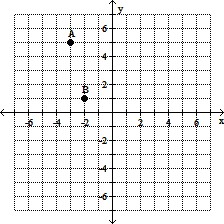
Mathematics
Specify the domain of the function.f(x) = 
A. x ? 4, x ? -4 B. x > 16 C. x ? 16 D. All real numbers
Mathematics