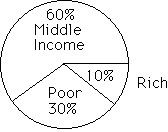
Describe the given distribution with a circle graph.The following figures give the economic distribution for 19,000 people who live in a certain county. ?
? ?
?
What will be an ideal response?
Mathematics
You might also like to view...
Find the measure of one interior angle of the polygon.
A. 90° B. 120° C. 60° D. 360°
Mathematics
Use a graphing calculator to solve the nonlinear system. Give x- and y-coordinates to the nearest hundredth.x2 + y2 = 13.85x = 3y - 1
A. {(3.42, 1.47), (-3.62, -0.87)} B. {(-3.41, -1.47), (3.62, 0.87)} C. {(-11.26, -3.42), (11.06, 4.02)} D. {(1.47, 3.42), (-0.87, -3.62)}
Mathematics
Look for a pattern and then predict the general term, or nth term, an, of the sequence. ,
,  ,
,  ,
,  ,
,  , . . .
A. an = 
B. an = 
C. an = 
D. an = 
Mathematics
Graph the hyperbola. Give the coordinates of the center as well as the values of a and b. -
-  = 1
= 1
A. center (1, -1), a = 7, b = 8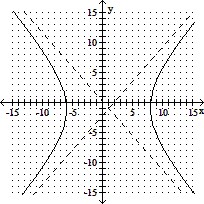
B. center (1, -1), a = 7, b = 8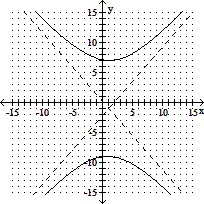
C. center (-1, 1), a = 7, b = -1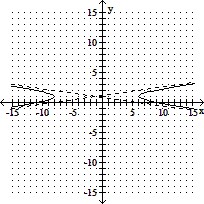
D. center (-1, 1), a = 8, b = 7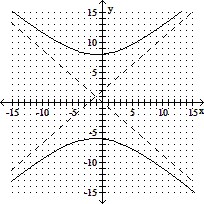
Mathematics