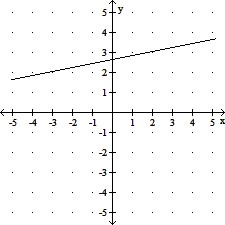
Make a numerical representation (table) of f for x = -2, -1, . . . , 2 then graph the function. Round table values to the nearest hundredth when necessary.f(x) =  x -
x - 

A. 
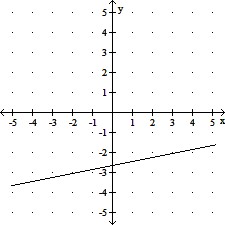
B. 
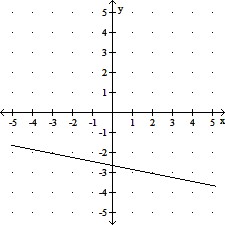
C. 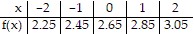
D. 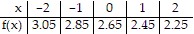

Answer: A
You might also like to view...
Write the expression in lowest terms.
A. x2 - 4x + 2 B. x2 + 2x + 4 C. x2 + 4 D. x2 - 2
Match the graph to the function listed whose graph most resembles the one given.
A. square root function B. square function C. cube root function D. cube function
Use the vertical line test to determine whether the graph represents a function.
A. function B. not a function
Solve the problem.Suppose that 5% of all adults over 40 have diabetes. A certain physician correctly diagnoses 90% of all adults over 40 with diabetes as having the disease and incorrectly diagnoses 3% of all adults over 40 without diabetes as having the disease.(a) Draw a tree diagram and label it with appropriate probabilities.(b) Find the probability that a randomly-selected adult over 40 does not have diabetes but is diagnosed as having diabetes.(c) Find the probability that a randomly-selected adult over 40 is diagnosed as not having diabetes.(d) Find the probability that a randomly-selected adult over 40 actually has diabetes, given that he/she is diagnosed as not having diabetes.
What will be an ideal response?