Use the vectors in the figure below to graph the following vector. 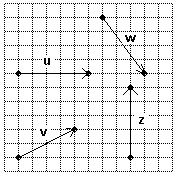 z - v
z - v 
A. 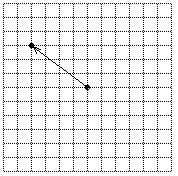
B. 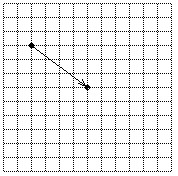
C. 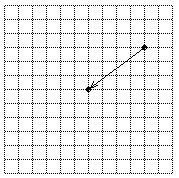
D. 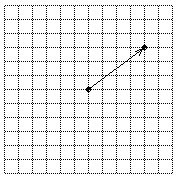
Answer: A
Mathematics
You might also like to view...
Add or subtract, if possible. Assume that all variables represent non-negative values. Simplify your answer.  -
- 
A. -6
B. -42
C. -6
D. 12
Mathematics
Add.
A. 90,566 B. 90,456 C. 90,556 D. 92,635
Mathematics
Match the equation with its graph.y = -3x
A. 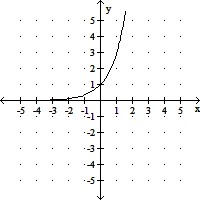
B. 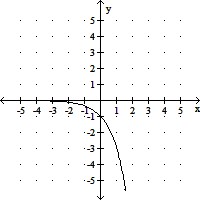
C. 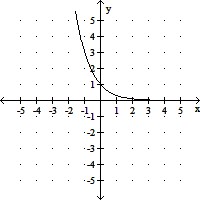
D. 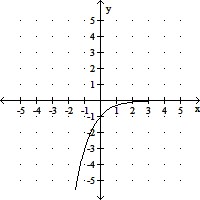
Mathematics
Solve the problem.The data below represent the average monthly cost of natural gas in an Oregon home. 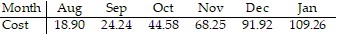
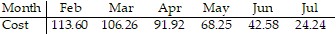
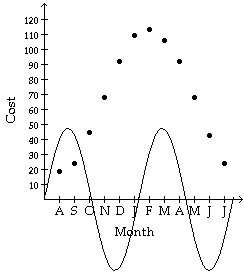 Above is the graph of 47.35 sin x. Make a scatter diagram of the data. Find the sinusoidal function of the form
  which fits the data.
What will be an ideal response?
Mathematics