Solve the problem.The following data represents the normal monthly precipitation for a certain city in Arkansas.  Draw a scatter diagram of the data for one period. Find the sinusoidal function of the form
  that fits the data. Draw the sinusoidal function on the scatter diagram. Use a graphing utility to find the sinusoidal function of best fit. Draw the sinusoidal function of best fit on the scatter diagram.
What will be an ideal response?
y = 2.17 sin (0.49x - 1.88) + 6.02
Mathematics
You might also like to view...
Evaluate the improper integral.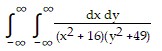
A. 
B. 
C. 
D. 
Mathematics
Solve the problem.Suppose you purchase a three-year bond with an APR of 2.5%. The face value of the bond is $6450. Find the purchase price of the bond.
A. $5931.03 B. $6933.75 C. $6000 D. $5958.43 E. $6042.15
Mathematics
Write out the first five terms of the sequence.an = 3n- 3
A. 0, 3, 6, 9, 12 B. 0, -3, -6, -9, -12 C. 0, 1, 2, 3, 4 D. 6, 9, 12, 15, 18
Mathematics
Match the graph of the rational function with its equation.
A. f(x) = 
B. f(x) = 
C. f(x) = 
D. f(x) = 
Mathematics