Predict the number of tick marks on the positive x - axis and the positive y-axis.[-600, 600, 10] by [-900, 900, 10]
A. 90; 60
B. 60; 90
C. 600; 900
D. 900; 600
Answer: B
You might also like to view...
Find all the spanning trees in the graph.
What will be an ideal response?
Express the sum or difference as a product.cos  + cos
+ cos 
A. 2 sin 2x sin 
B. 2 sin 2x sin x
C. 2 cos 2x
D. 2 cos 2x cos 
Match the correct viewing rectangle dimensions with the figure. 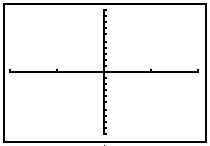
A. [-20, 20, 2] by [-20, 20, 2] B. [-16, 16, 4] by [-4, 4, 2] C. [-4, 4, 2] by [-4, 4, 2] D. [-4, 4, 2] by [-80, 80, 8]
Solve the problem.The following table shows the population (in thousands) of Anytown, USA. YEAR POPULATION 1950 80 1960 95 1970 115 1980 150 1990 200 2000 265Use a graphing calculator to fit a quadratic function f(x) to the data. Use this equation to predict the population in the year 2007. Round your answer to the nearest thousand.
A. 267,000 B. 316,000 C. 16,820,000 D. 345,000