Analyze the earthquake data graphed below and answer the question. The data displayed here are for recorded earthquakes from November to December in 2006. Earthquake magnitudes are binned such that 2 includes all magnitudes from 2 to less than 3, magnitude 3 includes those from 3 to less than 4 and so forth. 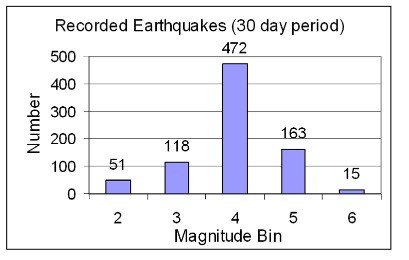 Smaller magnitude earthquakes occur more frequently than larger magnitude earthquakes. So why do these actual data show fewer magnitude 2 and 3 earthquakes than magnitude 4 earthquakes?
A. This region only experiences larger earthquakes.
B. The reported numbers are limited by technology.
C. The scientists who made that observation were wrong.
Answer: B
Environmental & Atmospheric Sciences
You might also like to view...
Topographic maps contain isolines
Indicate whether this statement is true or false.
Environmental & Atmospheric Sciences
What does carbon dioxide break down into once it is in the ocean?
A) Carbonic acid B) Bicarbonate C) Carbonate D) All of these choices
Environmental & Atmospheric Sciences
Compare and contrast solar water heaters and passive solar designs
What will be an ideal response?
Environmental & Atmospheric Sciences
The higher the sinuosity, the straighter the stream channel
Indicate whether the statement is true or false
Environmental & Atmospheric Sciences