?
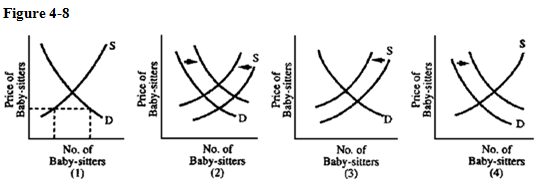
Families are having more children than families did 15 years earlier. As a result, families have more trouble finding baby-sitters and are shocked at the cost of child care. Which graph in Figure 4-8 best illustrates how the situation has changed?
A. 1
B. 2
C. 3
D. 4
Answer: D
You might also like to view...
An economy operating its plant and equipment at full capacity implies a capacity utilization rate of
A. 40 percent. B. 70 percent. C. 85 percent. D. 100 percent.
If a good has an absolute price elasticity of 1, the demand for the good is
A) unit elastic. B) inelastic. C) perfectly elastic. D) elastic.
If the intended aim of the price floor set in the graph shown was a net increase in the well-being of producers, then positive analysis would have us consider:
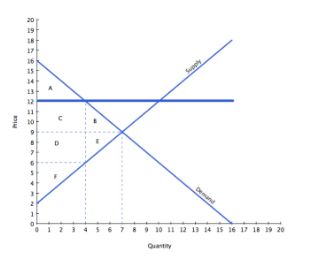
A. the policy to be effective if area C is larger than area E.
B. the policy to be effective if area E + B is larger than C +D + F.
C. the policy to be ineffective if area B is larger than area E.
D. the policy to be ineffective if area E + B is larger than A+C+D+ F.
Which of the following policies would a Keynesian expect to produce the largest decrease in income?
A. A reduction in government spending of $100 billion B. A decrease in transfer payments of $100 billion C. An increase in government spending of $100 billion D. A tax increase of $100 billion