Provide the proper response.To graph  -
-  = 1 on a graphics calculator, we must consider the union of the graphs of the two functions. y1 = 6
 and y2 = -6
 . Using the graph of y =
  - 1, explain (a) how the solution set of
src="https://sciemce.com/media/4/ppg__10627191645__f1q252g6.jpg" style="vertical-align: -17.0px;" /> - 1 ? 0 can be determined graphically and (b) how it relates to the domain of the hyperbola.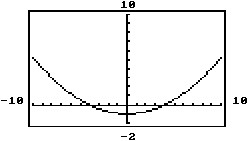
What will be an ideal response?
The graph of y =  - 1 lies above or on the x-axis in
  This set is the same as the domain of the given hyperbola.
Mathematics
src="https://sciemce.com/media/4/ppg__10627191645__f1q252g6.jpg" style="vertical-align: -17.0px;" /> - 1 ? 0 can be determined graphically and (b) how it relates to the domain of the hyperbola.
What will be an ideal response?
The graph of y = - 1 lies above or on the x-axis in This set is the same as the domain of the given hyperbola.
You might also like to view...
Solve the system by graphing. If there is no solution or an infinite number of solutions, so state. Use set notation to express the solution set.

A. no solution; ? B. {(3, 4)} C. {(-3, 4)} D. {(3, -4)}
Show by substitution whether the number r is a solution of the corresponding quadratic equation.15x2 + 32x + 16 = 0; r = - 
A. Yes B. No
Use < or > for ? to write a true sentence. Draw a number line if necessary.1205 ? 1207
A. > B. <
Solve the polynomial inequality and graph the solution set on a number line. Express the solution set in interval notation.x2 + 2x ? 3![]()
A. [-3, 1]![]()
B. (-1, 3)![]()
C. (-?, -1] ? [3, ?)![]()
D. [-1, 3]![]()