Graph.y2 - x2 = 
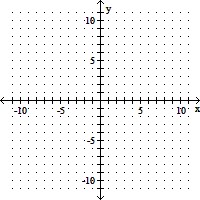
A. 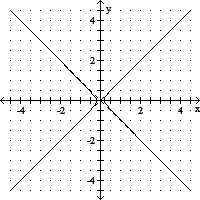
B. 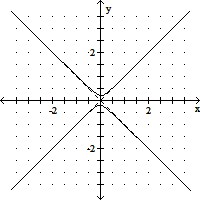
C. 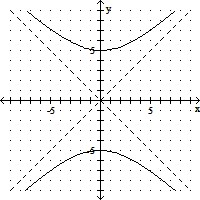
D. 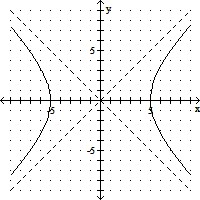
Answer: B
You might also like to view...
Find Z for a circuit containing R = 8.2 Kê and xL = 2.4 Kê.
a. 10.6 Kê b. 5.8 Kê c. 10 Kê d. 8.5 Kê
Construct a frequency distribution table for the following values of resistance measured on a sample of 47 ê resistors:
43 ê, 47 ê, 50 ê, 44 ê, 43 ê, 46 ê, 45 ê, 47 ê, 47 ê, 51 ê, 43 ê, 46 ê, 48 ê, 47 ê, 47 ê, 46 ê, 45 ê, 48 ê, 46 ê, 46 ê, 48 ê. The following are values of resistance measured on a sample of 47 ê resistors. 43 ê, 47 ê, 50 ê, 44 ê, 43 ê, 46 ê, 45 ê, 47 ê, 47 ê, 51 ê, 43 ê, 46 ê, 48 ê, 47 ê, 47 ê, 46 ê, 45 ê, 48 ê, 46 ê, 46 ê, 48 ê.
Factor as completely as possible. If unfactorable, indicate that the polynomial is prime.-75a2 - 95a + 50
A. (-25a + 10)(3a + 5) B. -5(5a + 2)(3a - 5) C. -5(5a - 2)(3a + 5) D. (5a - 2)(-15a - 25)
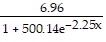
Make a scatterplot of the data. Then find an exponential, logarithmic, or logistic function f that best models the data. Round function values to the nearest hundredth.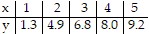

A. Logarithmic: f(x) = 1.39 + 4.86 ln x
B. Logistic: f(x) = 
C. Logarithmic: f(x) = 1.29 + 5.19 ln x
D. Logistic: f(x) =