Use the following graph for a competitive market to answer the question below.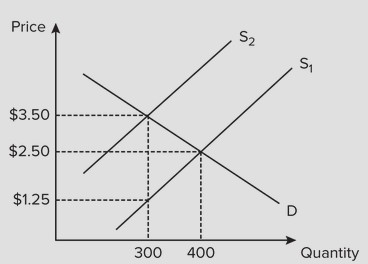 Assume the government imposes $2.25 tax on suppliers, which results in a shift of the supply curve from S1 to S2. The price the consumer pays for the product after the tax is imposed on the suppliers is
A. $3.50
B. $2.25.
C. $1.25.
D. $2.50.
Answer: A
You might also like to view...
The table below shows the relationship between the number of times you get your car washed each month and your total monthly benefit from car washes. Each car wash costs $15.Number ofCar WashesPer MonthTotal MonthlyBenefit fromCar Washes0$01$202$363$484$565$60What is the marginal benefit of the 3rd car wash each month?
A. $12 B. $4 C. $48 D. $16
The values of real GDP and real GNP are almost the same for the United States
Indicate whether the statement is true or false
The Federal Reserve (Fed) was created by the Congress as an independent agency
a. True b. False Indicate whether the statement is true or false
The circular flow diagram depicts the economy consisting of:
a. the government and households. b. households and international companies. c. households and firms. d. firms and the government.