Solve the problem.Economists use what is called a Leffer curve to predict the government revenue for tax rates from 0% to 100%. Economists agree that the end points of the curve generate 0 revenue, but disagree on the tax rate that produces the maximum revenue. Suppose an economist produces this rational function 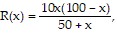 where R is revenue in millions at a tax rate of x percent. Use a graphing calculator to graph the function. What tax rate produces the maximum revenue? What is the maximum revenue?
A. 35.8%; $276 million
B. 34.0%; $271 million
C. 41.2%; $264 million
D. 36.6%; $268 million
Answer: D
Mathematics
You might also like to view...
Provide an appropriate response.Draw an object with translation symmetry.
What will be an ideal response?
Mathematics
Use the given graph to find the x-intercepts and zeros of the function.
A. (-5, 0), (2, 0); -5, 2 B. (-2, 0), (5, 0); -2, 5 C. (5, 0), (2, 0); 5, 2 D. (-5, 0), (-2, 0); -5, -2
Mathematics
Solve and graph the inequality and graph the solution.y + 11 < 5 ![]()
A. (-6, ?)![]()
B. (-?, -6]![]()
C. [-6, ?)![]()
D. (-?, -6)![]()
Mathematics
Perform the indicated operation and simplify. +
+ 
A. 
B. 
C. 1
D. 
Mathematics