Solve the problem.The following data represents the normal monthly precipitation for a certain city in Arkansas.  Draw a scatter diagram of the data for one period. Find the sinusoidal function of the form
  that fits the data. Draw the sinusoidal function on the scatter diagram. Use a graphing utility to find the sinusoidal function of best fit. Draw the sinusoidal function of best fit on the scatter diagram.
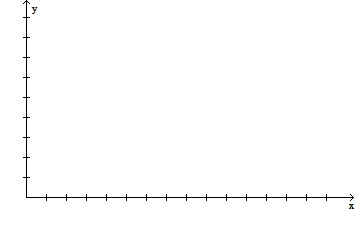
What will be an ideal response?
y = 2.17 sin (0.49x - 1.88) + 6.02
Mathematics
You might also like to view...
Simplify.-?-22?
A. 44 B. 22 C. 0 D. -22
Mathematics
Solve the problem.A satellite dish has a parabolic cross section and is 12 ft deep. The focus is 4 ft from the vertex. Find the width of the satellite dish at the opening. Round your answer to the nearest foot.
A. 32 ft B. 28 ft C. 30 ft D. 36 ft
Mathematics
Draw the angle.- 
A. 
B. 
C. 
D. 
Mathematics
Write the sentence as an equation. Use x to represent "a number."If ten times a number is decreased by 6, the result is 144.
A. 10x - 6 = 144 B. 6(10 - x) = 144 C. 10(x - 6) = 144 D. 6 - 10x = 144
Mathematics