The graph below shows the number of students enrolled in various courses at State University in spring 2000. Each bar represents a different course, and the height of the bar represents the number of students enrolled. Use the graph to answer the question.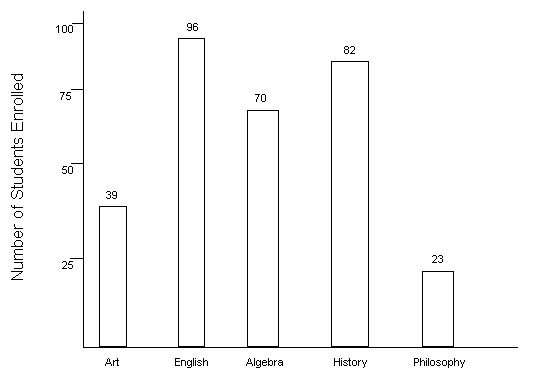 Which course had the lowest enrollment?
A. Algebra
B. Philosophy
C. Art
D. English
Answer: B
Mathematics
You might also like to view...
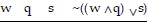
Construct a truth table for the statement.~((w ? q) ? s)
A. 
| T | T | T | F |
T F T F
T F F T
F T T F
F T F T
F F T F
F F F T
B.
| T | T | T | T |
T F T T
T F F F
F T T T
F T F F
F F T T
F F F F
Mathematics
Add the polynomials.(-  x2 +
x2 +  x +
x +  ) + (-
  x2 -
x2 -  x -
x -  )
)
A. -  x2 -
x2 -  x +
x + 
B. 4x2 - 2x - 
C. -  x6 +
x6 + 
D. -  x4 -
x4 -  x2 +
x2 + 
Mathematics
Find the domain of the logarithmic function.g(x) = log3(6x)
A. (0, ?) B. (6, ?) C. (3, ?) D. (-?, 0)
Mathematics
Solve.Given log102 = 0.3010 and log103 = 0.4771, evaluate log10 108.
A. 1.8572 B. 2.0333 C. 0.8616 D. 0.1992
Mathematics