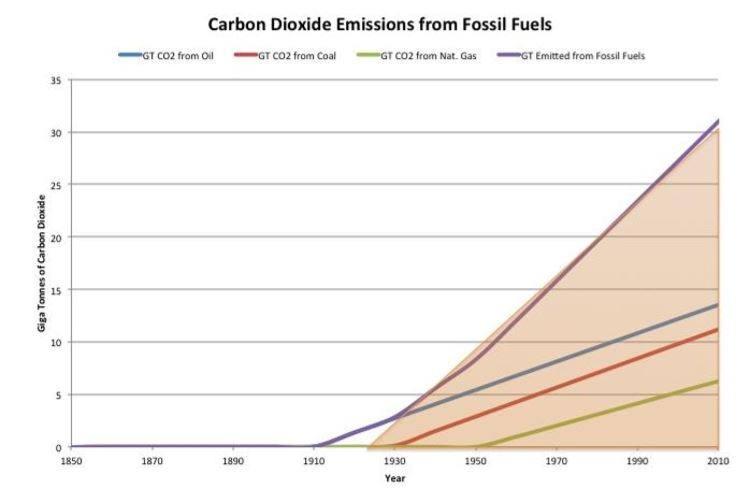
The sum of all CO2 emissions from 1850 to 2010, from fossil fuel emissions is equal to the total area under the graph from Problem 6-33.
a. Based on this method, how much CO2 was emitted from fossil fuels between 1850 and 2010?
b. How does this compare to the atmospheric increase in CO2 between 1850 and 2010, based on measurements of CO2 in ppm in the atmosphere between 1850 and 2010?
What will be an ideal response?
The total emissions can be approximated by calculating the shaded area from the graph, which is approximately equal to:
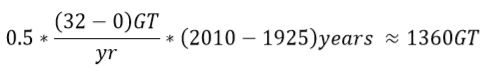
The additional atmospheric CO2 mass was calculated in example 6.1 to be 517 x 1012 kg or 517 GT, or 38% of the carbon dioxide emitted from fossil fuels remains in the atmosphere.
You might also like to view...
Whenever an engine is disassembled, the piston rings are replaced.
Answer the following statement true (T) or false (F)
The majority of insulin is harvested from the pancreases of cattle
Indicate whether the statement is true or false
Technician A says that leakage testing identifies leakage in aspecific circuit component. Technician B says thathydraulic oil temperature should be measured because system pressure and flow specifications are calculated withthe system at operating temperature. Who is correct?
A. Technician A B. Technician B C. Both D. Neither
On many of today's vehicles, the steering wheel controls transmit a(n) _____ signal.
A. binary B. analog C. amperage D. Both A and C are correct