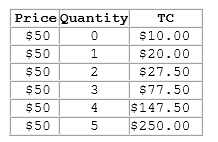
According to the table shown, what is the firm's marginal revenue from the 3rd unit produced?
This table shows the total costs for various levels of output for a firm operating in a perfectly competitive market.
A. $50
B. $90
C. $150
D. $60
A. $50
You might also like to view...
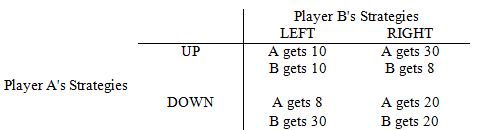
Refer to Game Matrix IV. The Nash Equilibrium for the game is
Game Matrix IV
The following questions refer to the game matrix below.
Player A can play the strategies UP and DOWN and Player B can play the strategies LEFT and RIGHT.
a. UP, LEFT
b. UP, RIGHT
c. DOWN, LEFT
d. DOWN, RIGHT
Why do firms in an oligopoly find it difficult to cooperate and not cheat on a cartel agreement?
What will be an ideal response?
On a linear demand curve, demand is ________ at large quantities than it is at the middle of the demand curve.
A. more elastic B. less elastic C. equally elastic D. There is insufficient information in the question.
Refer to the information provided in Figure 12.1 below to answer the question(s) that follow. 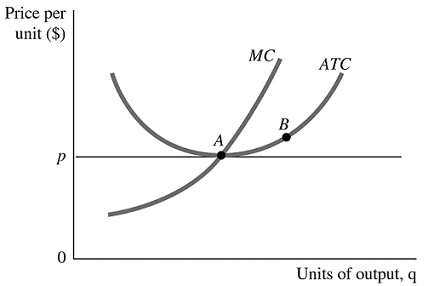 Figure 12.1 Refer to Figure 12.1. This firm is currently at Point B on the ATC curve. If this firm moves toward Point A, this will make the
A. economy more efficient. B. economy less stable. C. economy more stable. D. distribution of outcome more equitable.