Refer to the accompanying figure. A decrease in demand is represented by a shift from: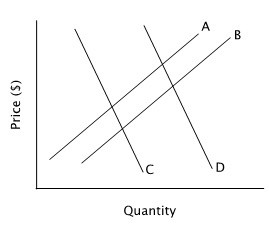
A. curve B to curve A.
B. curve C to curve D.
C. curve D to curve C.
D. curve A to curve B.
Answer: C
You might also like to view...
If the demand curve for bologna shifts to the right as income falls then bologna is a(n):
A. inferior good. B. complementary good. C. normal good. D. substitute good.
When the charge against ALCOA for exercising monopoly control of the aluminum market was brought to court, ALCOA's market share, excluding scrap aluminum, was
a. 100 percent b. 90 percent c. 80 percent d. 65 percent e. 33 percent
If government taxes a firm which pollutes this will
a. increase the demand for the good produced. b. decrease the supply of the good produced. c. increase the equilibrium quantity of the good produced in the market. d. decrease the equilibrium price of the good produced in the market. e. all of the above.
Use the figure below to answer the following question.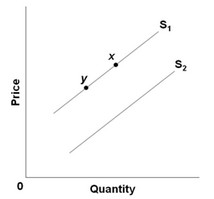 A movement along the supply schedule from point x to point y depicts
A. a decrease in supply. B. an increase in quantity supplied. C. a decrease in quantity supplied. D. an increase in supply.