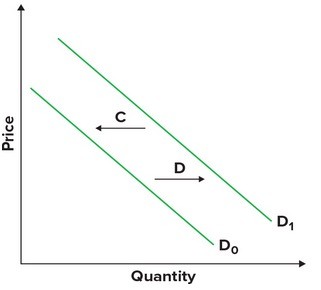
Refer to the graphs shown. An increase in quantity demanded is best shown by which arrow?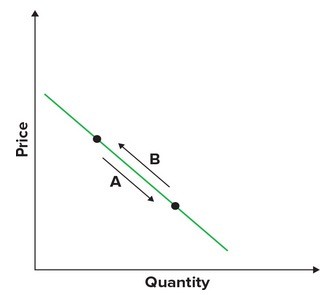
A. A
B. B
C. C
D. D
Answer: A
You might also like to view...
Sandy's current consumer surplus for candy is 20. Candy is an inferior good for her. When her income increases and the price of candy remains unchanged, her consumer surplus will
A) increase. B) decrease. C) remain the same. D) Not enough information.
Assume that the equilibrium price for a good is $5 . If the market price is $10, a:
a. shortage causes the price to decline toward $5. b. surplus causes the price to rise above $10. c. shortage causes the price to rise above $10. d. surplus causes the price to decline toward $5.
If we can conclude that human life has a finite value, cost-benefit analysis can lead to solutions in which human life is worth less than the cost of a potential project
a. True b. False Indicate whether the statement is true or false
Basis may change if
A. a new ethanol plants is built locally. B. a large capacity train terminal is built by CGB. C. a drought resulted in a short crop. D. All of the above.