Figure 11-5
?

Figure 11-5 contains a production possibilities frontier for wheat and milk production. Explain why Point C is not a point where resources are being used efficiently.
What will be an ideal response?
From Point C, it is possible to move to Point A, and make the economy better off in wheat without making it worse off in milk; or, a move from Point C to Point B would make the economy better off in milk without making it worse off in wheat.No point below the frontier represents an efficient allocation of resources; efficiency is achieved at points on the frontier only.
You might also like to view...
The above figure represents Tony's Pizza Parlor, a firm in monopolistic competition
a. What quantity will be produced? b. What price will be charged? c. What is Tony's total cost? d. What is Tony's total revenue? e. What is Tony's economic profit or loss? f. Is this a long-run equilibrium? Why or why not?
The discovery of new oil deposits will cause
A) the long-run aggregate supply curve to shift to the right and the short-run aggregate supply curve to shift to the left. B) the long-run aggregate supply curve to shift to the right, but not the short-run aggregate supply. C) the short-run aggregate supply curve to shift to the right, but not the long-run aggregate supply curve. D) both the long-run and the short-run aggregate supply curves to shift to the right.
Define the following terms and explain their importance to the study of economics.
a. Pure monopoly b. Barriers to entry c. Patent d. Natural monopoly e. Sunk costs
Refer to the accompanying figure. An increase in supply is represented by a shift from: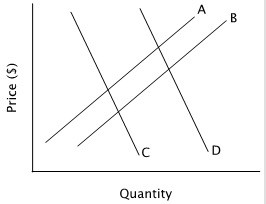
A. curve C to curve D. B. curve B to curve A. C. curve A to curve B. D. curve C to curve B.