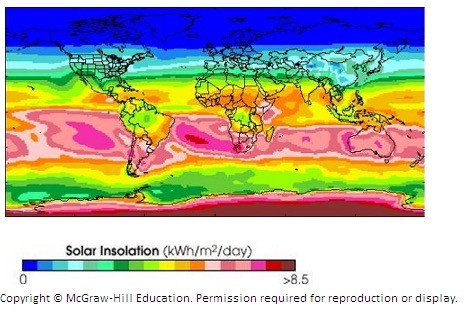
What time of year is represented by the global insolation data shown in the diagram below?
A. January
B. July
C. No way to tell
Answer: A
Environmental & Atmospheric Sciences
You might also like to view...
What percent of Russia's farmland had been privatized by 2003?
A) 25% B) 10% C) 50% D) 90% E) 5%
Environmental & Atmospheric Sciences
?What is the difference between net energy and net energy ratio?
Fill in the blank(s) with the appropriate word(s).
Environmental & Atmospheric Sciences
A(n)________ is a homogenous volume of air defined based on its temperature, and moisture characteristics
A) cyclone B) air mass C) front D) parcel
Environmental & Atmospheric Sciences
________ is a naturally occurring substance that is potentially toxic to people
A) Carbon dioxide B) Radon C) DDE D) PCB E) Bisphenol A (BPA)
Environmental & Atmospheric Sciences