Maps are secondary data sources when
A) they are used to provide an interpretation for addressing some other question.
B) they have undergone two or more revisions in order to enhance their accuracy.
C) they express coordinates not only in latitude-longitude but also in at least one other survey system.
D) they are available in both paper and online formats.
A) they are used to provide an interpretation for addressing some other question.
You might also like to view...
Why are Aw (tropical savanna) climates found in bands north and south of the Af (tropical wet) climates?
The following questions are based on the diagram of the Köppen climate distribution on a hypothetical continent (Figure 23-2). It may also be helpful to compare the hypothetical continent with the map of actual climate distribution color Map T-29 in the back of the Lab Manual and Figure 23-3 showing the influence of the seasonal shifts of the ITCZ and subtropical highs along the west coasts of continents. In answering the questions, consider both the characteristics of a climate and the dominant controls producing that climate.
Use your knowledge of plate boundaries to answer whether an earthquake is likely or unlikely to occur at the location of the red circle.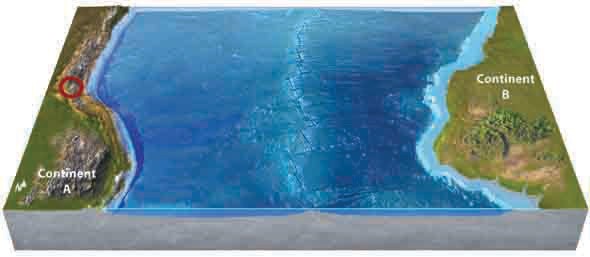
A. likely B. unlikely
The steep downwind slope of a dune that lies at the angle of repose is known as the ____________________
Fill in the blank(s) with correct word
What are the three factors that influence viscosity of a lave?
What will be an ideal response?