Compared to 1968, in 2008 income distribution would be considered
A. much more equal.
B. somewhat more equal.
C. about as equal.
D. Much less equal.
D. Much less equal.
You might also like to view...
A time-series graph reveals whether there is a ________, which represents ________
A) trend in a variable; a general tendency for the variable to rise or fall B) relationship between two variables; a cross-section relationship C) trends in two variables; unrelated variables D) relationship between two variables; a trend in a variable E) cross-section relationship; a general tendency for the variables to rise or fall
An increase in the wage rate will cause
a. increased employment b. a leftward shift in the labor supply curve c. an upward movement along the labor supply curve d. a rightward shift of the labor supply curve e. a leftward shift of the labor demand curve
The short-run aggregate supply (SRAS) curve shows the quantity
A) demanded of all goods and services at different price levels, ceteris paribus. B) supplied of all goods and services at a particular price level, ceteris paribus. C) supplied of all goods and services at different price levels, ceteris paribus. D) supplied of GDP at a particular price level, ceteris paribus.
Based on the graphs for an increase in aggregate demand and the Phillips curve, we can see that when inflation is high, ______.
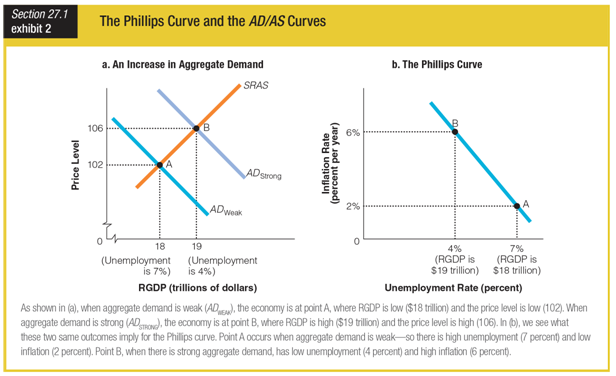
a. RGDP is low
b. unemployment is high
c. aggregate demand is weak
d. aggregate demand is strong