Refer to the graph. Economic output in year 0 is $20 billion. What is potential output in year 2?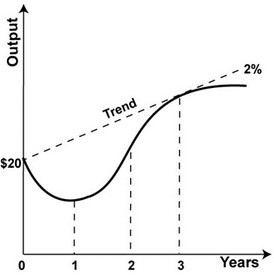
A. $21.2 billion
B. $20 billion
C. $20.4 billion
D. $20.8 billion
Answer: D
You might also like to view...
A trade surplus occurs when:
A. quotas exceed tariffs. B. tariffs exceed quotas. C. imports exceed exports. D. exports exceed imports.
A firm uses labor and capital. To tell if the firm is technologically efficient, you
A) do not need to know the cost of labor or the cost of capital. B) need to know the cost of capital but not the cost of labor. C) need to know the cost of labor and the cost of capital. D) need to know the cost of labor but not the cost of capital.
A patent protects an inventor's creation from being copied or stolen for a period of
A) 10 years. B) 20 years. C) 30 years. D) 50 years.
The monetary value of all final goods and services produced by the United States economy during a year is:
a. DI b. GDP c. NDP d. NI